How to Read Results from Insider Trading Alerts
Every Sunday through Thursday (excluding days when the market is closed), the form 4 algorithm will identify promising stocks for purchase the next day. The email you receive will include a short overview of stocks we consider good selections, along with each one’s historical performance. On our website, you’ll find detailed illustrations of past trades and breakdowns of each stock.
Insider Purchase Data: An Overview
Every Sunday through Thursday evening (excluding those days when the market is closed), you will receive a list of one to ten stocks that have been identified by the screener, straight to your email. This email will contain simple purchase data and is meant to serve as a quick digest. However, this guide was created for those who want more detail and use of the data collected.
The screener will first illustrate the data surrounding each stock and its purchase. Let’s take this table one column at a time.
Date of Filing is the date the insider trader notified the SEC of their actions.

Next is the stock’s Ticker.
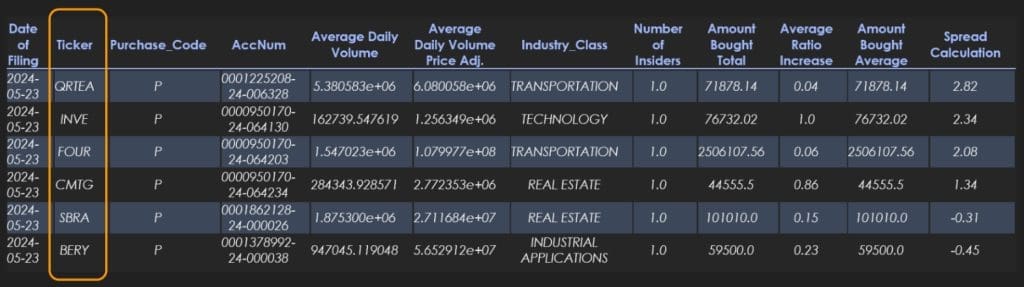
99% of the time, the Purchase Code will be a P, which means it’s an open-market purchase where the insider bought these stocks through their own brokerage account.

In the next column, there’s the AccNum (Accession Number). This is a unique identifier tied to the filing that you can copy and paste into Google to find that exact filing.

Average Daily Volume is the average number of shares traded on this stock, daily, over the past four months.

Average Daily Volume Price Adj. gives you the average dollar value of money transacted daily over the past four months. This is essentially the Average Daily Volume’s average price.

Industry Class tells you the industry that the filing belongs to.

Number of Insiders represents the total number of filings in this ticker over the given day. If there’s more than one insider who’s traded a filing, it can be a signal that multiple people know about a promising situation.

Amount Bought Total provides the total amount all insiders bought this day, in dollars.
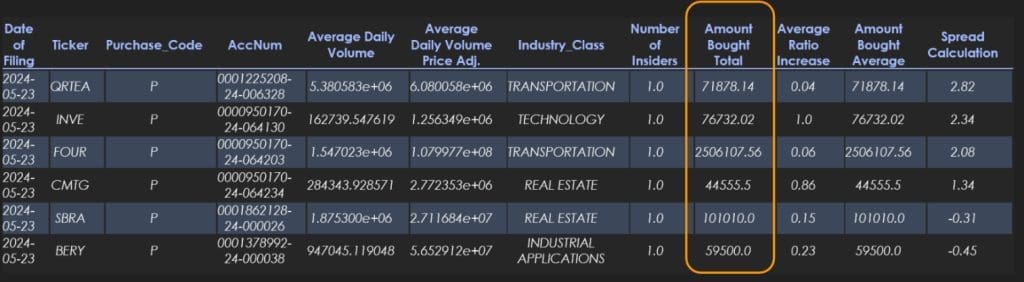
Average Ratio Increase gives the ratio increase of an insider’s holdings. For example, a 0.03 average ratio increase means that the average insider trader for that day increased their holdings by 3%. This is important because a $10,000 buy may mean very little to a CEO if it’s only .1% of his portfolio and he bought it without significant reason or expectation. We recommend considering this number when trading.

Amount Bought Average is the average amount that each insider bought.

Spread Calculation gives the historical highs and lows and acts as a relative ranker for the day’s stocks. The higher this number, the better the historical “spread” and therefore your chance of making money.

The Summary Table, Compiled Using Historical Data
This table takes all individual historical data for each stock and condenses it into averages, highs, and lows. This can be helpful for at-a-glance analysis.
First is the Ticker for each stock. This is just to keep you oriented. Tickers are in the same order as the table of picks.

Next is the CTO or Close-to-Open information. This is the percentage increase or decrease of the stock from the close of the previous day to the open of the day after the filing. For example, if there is a filing on May 30, this number is the percentage increase or decrease from May 29 close to May 30 open. We give the average of this value, the highest it’s been, and the lowest it’s been. You can use this to see if the current movement is within historical limits.

Highreturn is the percentage return from the open to the high of the day. Again, we will give the average, the high, and the low from this stock’s historical returns on previous insider tracks.
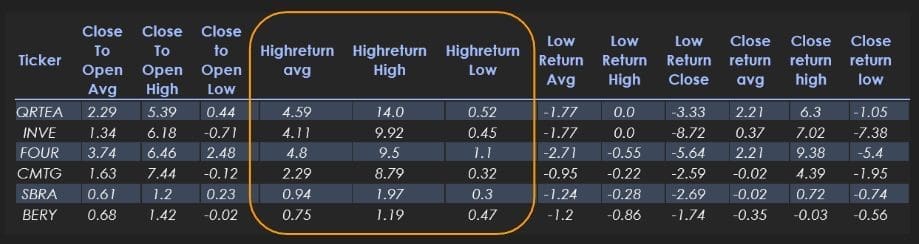
The Low Return is the percentage return from the open to the low of the day. This can be used to set stop losses and expected moves.

The Close Return is the return from the open to the close of that day. The same diagnostics as previous are given.

The second half of this table supplies more complex numbers, as well as comparing the stock’s historical performance to the overall market.
The Probability of Return number is a volatility-adjusted metric that gives a lower value if the stock goes higher. It essentially will inverse the return of the stock. The average stock has a 50% return chance—right in the middle.

The Correlation of Highreturns represents the correlation of the open to the high for the given ticker and the overall market. If this number is high (closer to 1) it means that the ticker is likely to move big when the market moves big. Close to -1 means they will be inverse. Examples of correlations you might see would be:
- High Correlation: 0.89
- Close Correlation: 0.61
- Probability Correlation: 0.98
The Correlation of Closereturns is the correlation of the open to the close for the given ticker and the overall market. If this number is high (closer to 1) it means the stock will close positive if the market closes positive. Examples of negative correlations you might see would be:
- High Correlation: -0.63
- Close Correlation: -0.87
- Probability Correlation: -0.56
The Probability Correlation represents the strength of the relationship between the stock’s return probability and the overall market’s return probability. This is essentially a volatility-adjusted linear correlation of returns.

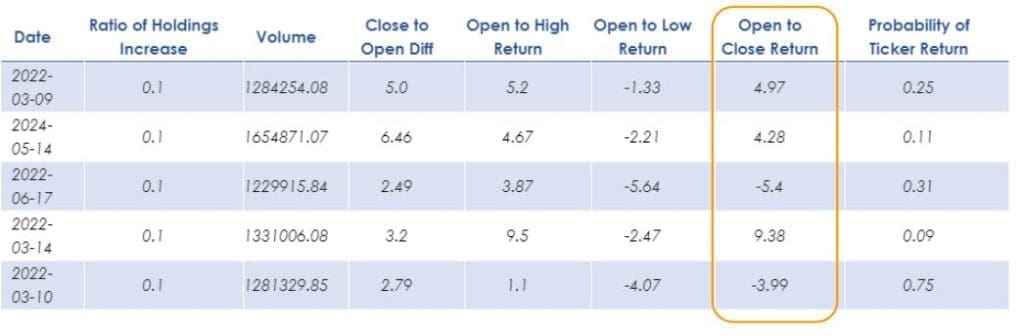
Individual Historical Data Tables
First, the Date of the previous insider filing is provided. Note that each of the previous filings would have met the screener characteristics.

Next, the table has a column for the Ratio of Holdings Increase. Again, this is how much insider(s) increased their position on that date, on average.

The Volume of the stock during the four months leading up to that filing is displayed. This can give you an idea of the popularity of the stock during that time frame.

The Close to Open Diff value is one of the most important elements in this collection of data. It is simply the percent increase or decrease between the close of the previous day and the open of the day after the filing.
For example, if this value is 5, the stock increased overnight and in premarket trading by 5% before the stock market opened that day. This is important because you want to invest in stocks that show movement (but not too much movement) after hours.
If the stock increases more than 5% in after-hours and premarket trading, there’s a good chance that a lot of your potential profit has already been consumed. If the stock did not move at all (a value of 0), you are seeing a lack of reaction by the stock to the insider trade. Watch this value closely in historical data as you trade.
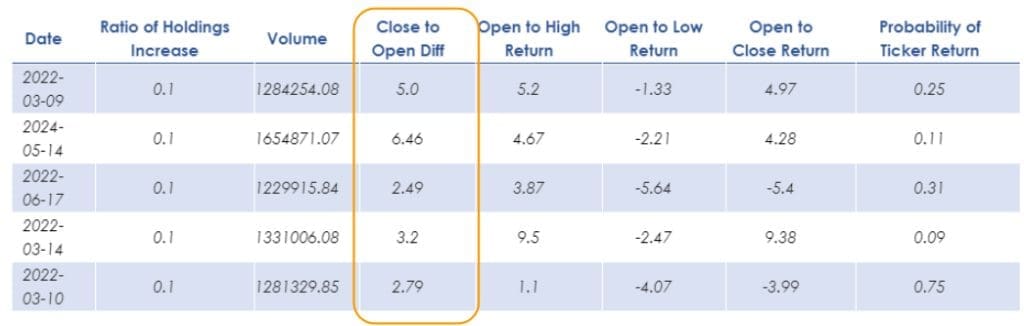
The Open to High Return is the percentage return you would have experienced if you had bought this stock at the open of the day after the insider filing and sold at its high that day. This can be used to get an idea about where to profit-take for each stock.

The Open to Low Return is the percentage return you would have experienced if you had bought at open the day after filing and sold at the stock’s low that day. This can be used to identify a good start for a stop loss.

The Open to Close Return is the percentage return you would have experienced if you had bought at open the day after the insider filing and sold at the close of the day.
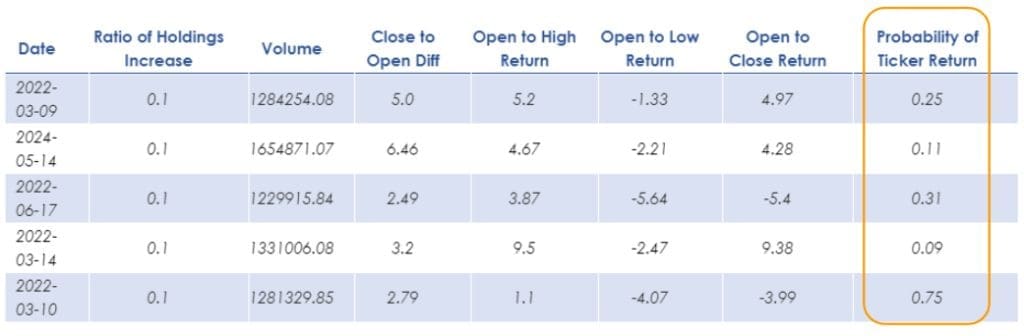
Probability of Ticker Return is another important variable. For each stock, a probability distribution of its high return is calculated (using proprietary methods) and then the probability of the return can be displayed. You can use this to compare the return of the stock to itself and see if the move following the trade was less than probable. You want a move following a trade to be less probable, and thus the probability of the return to be lower.
Think of it this way: If Apple opens tomorrow at $500 and only goes down from there, there’s a 100% chance that Apple reaches $500. If AAPL opens at $500 and goes up to $501, there’s an approximate 98% chance that this will occur. The more the stock goes up, the lower the chance of that occurrence. Probability of Occurrence and Return at the High are inverse.
We can now compare stocks to themselves since each stock has different volatility levels during any given day. One stock’s 5% movement during a day may be common, but that may be uncommon for a different stock.
For the next half of the table, the data from the first half is mirrored, except it’s for SPY—representative of the market at large. This will allow you to see if the stock follows SPY. If SPY has bad days, does the stock also have bad days? Do the patterns of probability follow each other?

The final column provides the stock’s Dollar Value Bought for all qualifying trades by all insiders.

For ease of analysis, all of the data for each ticker is combined and put into one table that displays averages for all of the aforementioned tables.

From this table, we can see that FOUR, INVE, and QRTEA are likely our best bets for the next day.
Historical Data Examples
Some Let’s look at the performance of the picks from the examples above. As a reminder, this chart covers stock picks and their historical performance at a glance.

If we look at historical performance, we see that three of the picked stocks stand out (QRTEA, INVE, and FOUR). They have the highest Highreturn, meaning they increased the most from the day’s open to the high of the day.
This is calculated by determining which stock has the highest high return average and the highest low return average. If the Highreturn Average MINUS Lowreturn Average IS GREATER THAN 0, we can assume that the risk of getting the stock at the value of the day’s open is low.
Look at the stock BERY. It has a negative spread on this high-and-low return comparison, meaning it has historically gone lower. With a high return average of .89 and a low return average of -1.37, its spread is .48. Compare this to INVE, with a spread of 3.05.
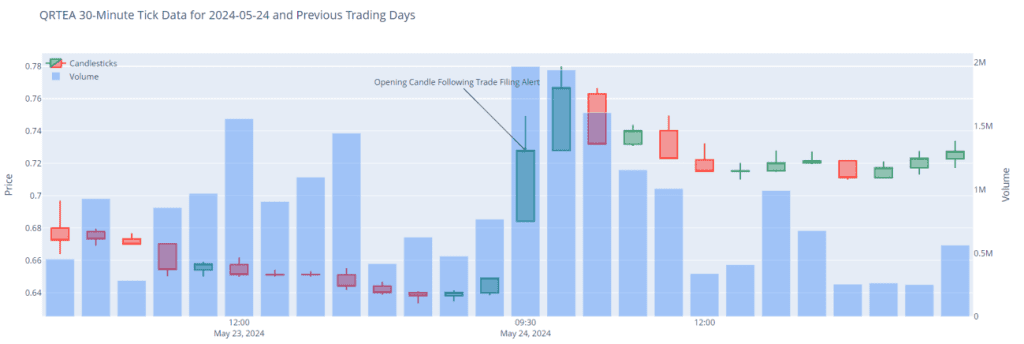
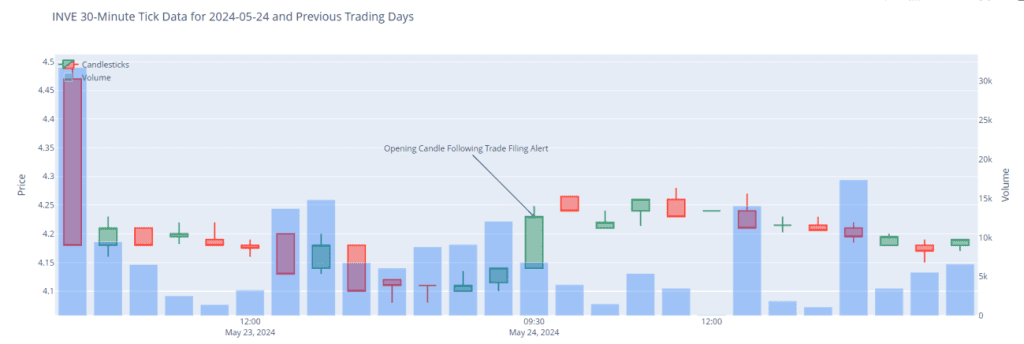
For 5/24/2024, decided to buy QRTEA, INVE, and FOUR. The results are illustrated below.
On QRTEA, we make about 10% in an hour. These charts point to the candle that the insider filing predicted BEFORE this candle came out.
On INVE, we don’t do as well but we still make our 3% profit target within an hour and can sell once it begins to reverse momentum.
On FOUR, we make good money the entire day, ending the day up 4% on our position. Amazing! The other two stocks made modest initial gains, but largely traded sideways, as expected, for the rest of the day.

Another really big note to make: Be sure the stock you want to trade the next day does not go up too much in premarket trading. You don’t want it to eat up all the momentum before the market opens. On the other hand, you don’t want too little price action after hours because it signals less interest in the stock.
Remember that according to the historical data, these were the three stocks most likely to pop the next day. You want to evaluate the historical returns of the stocks and how correlated they are to the market. This historical analysis, in conjunction with our filters behind the scenes, gives you a significant edge. The screener does not guarantee results and does not take the place of a financial advisor.